
Scientists recommend filtered tap water and drinking from a stainless steel reusable bottle.
In A Nutshell
- Switching to tap water in a glass or stainless steel container can cut your plastic particle exposure in half while saving money
- Plastic bottled water contains an average of 6 million plastic particles per liter, three times more than what’s found in tap water (2 million)
- Over half of these particles are nanoplastics, meaning they’re so small they can enter your bloodstream and, in lab studies, have crossed into brain tissue
- The plastic bottle itself is contaminating your water: researchers found the same plastics used to make bottles and caps floating inside the water
Every time you take a sip from that plastic bottle, you’re drinking somewhere between 2.6 and 11.5 million tiny plastic particles per liter. If you’re filling a glass from the tap instead, you’re typically getting between 1.6 and 2.6 million particles. The cleanest bottled water samples matched the most contaminated tap water samples, but on average, bottled water contains roughly double the plastic particles.
New research from The Ohio State University reveals that most bottled water contains significantly more plastic particles than treated tap water, and most of those particles are so small they were invisible to previous detection methods. Over half of what researchers found were nanoplastics, pieces smaller than a speck of dust that in experimental studies have shown the ability to slip through cell walls and potentially reach the brain.
The study, published in Science of the Total Environment, is one of the first to directly compare bottled and tap water using technology sensitive enough to spot these microscopic invaders. What it found should give anyone clutching a plastic water bottle pause.
Invisible Contamination
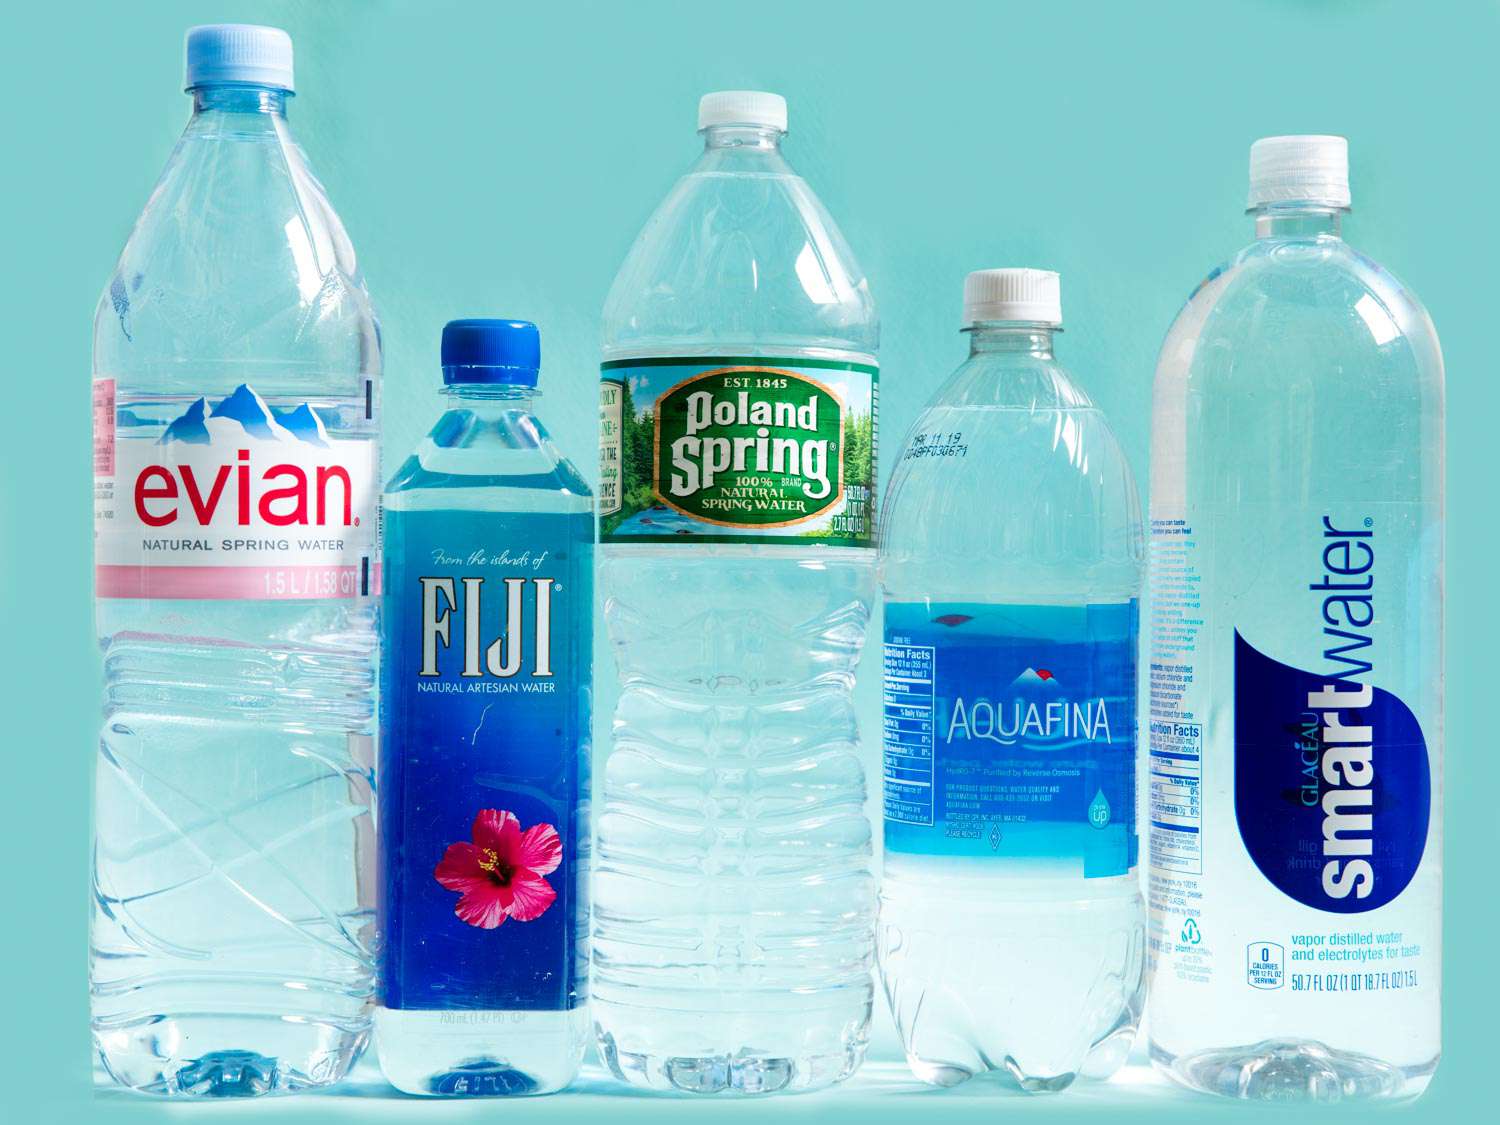
Researchers Megan Jamison Hart and John Lenhart tested six brands of bottled water and samples from four Ohio water treatment plants. The bottled water ranged from 2.6 to 11.5 million particles per liter, while tap water stayed between 1.6 and 2.6 million particles per liter.
To put that in perspective, a typical reusable water bottle holds about three-quarters of a liter. Fill it with bottled water and you could be drinking between 2 and 9 million plastic particles. Fill it from the tap and that drops to roughly 1 to 2 million.

The difference gets more concerning when you look at particle size. Nanoplastics made up 66 percent of what researchers found in bottled water, compared to just over half in tap water. These particles measure less than one micrometer, about 100 times smaller than a human hair. At that size, they don’t always pass through your digestive system. They can cross into your bloodstream, accumulate in organs, and lab studies suggest they may even penetrate the barrier protecting your brain.
“My first reaction to seeing the particle concentrations was exactly what you expected,” Hart told StudyFinds. “I thought that it couldn’t be right and triple-checked my math to make sure I didn’t make a mistake. When we didn’t see a mistake, we focused on the size distribution and realized it was so high because of the inclusion of nanoplastics.”
Your Bottled Water Is Part Of The Problem
The types of plastic researchers found in bottled water tell a troubling story. The most common polymer was PET, the same plastic used to make the bottles themselves. Second was polyamide, often used in the filtration systems that purify bottled water. Third was rubber, likely from the seals and gaskets in bottling equipment.
All six brands tested came in PET bottles with either PET or polyethylene caps. The plastic meant to contain your water is contaminating it. Every time you open and close the cap, every jostle in your bag, every temperature change may release more particles into what you’re about to drink.
Tap water showed a different pattern. Polyamide was most common, followed by rubber and various polyesters. The plastics in tap water probably come from the original source, rivers and lakes where plastic pollution is well-documented, rather than from the treatment process itself.
The Surprising, Yet Not-So-Surprising Contaminant
Perhaps the study’s strangest finding was rubber. It showed up in every single sample, tap and bottled. Yet most previous research on drinking water never mentions it.
That’s not because rubber isn’t there. It’s because most studies only look for traditional plastics and skip elastomers like rubber. The detection methods researchers typically use have trouble identifying rubber’s chemical signature. By including it, this study paints a more complete picture of what’s actually in our water.
Where does the rubber come from? In bottled water, probably from seals and tubing in purification and bottling equipment. In tap water, the researchers suggest it most likely comes from the seals, gaskets, and pumps within the water treatment plant itself, though it could also persist from source water including tire particles that wash into rivers and lakes.
“I was initially surprised by finding rubber in every sample, since it is not reported in many similar studies, but thinking about it in context, it is not that surprising that we found rubber in all of the samples,” notes Hart. “There have been a number of studies that have looked at rubber in environmental samples, specifically tire wear particles, so we know rubber can and will break down into smaller [microplastics] and [nanoplastics]. In drinking water treatment and the bottling process, there are going to be rubber components like gaskets and tubing that will shed rubber into the water.”

We’ve Been Missing Most Of The Plastic
The particle counts in this study dwarf what previous research reported. That’s not because water suddenly got more contaminated. It’s because we couldn’t see most of the problem.
Standard techniques for identifying microplastics only work on particles bigger than 5 to 10 micrometers. The Ohio State team used scanning electron microscopy and a newer method called optical photothermal infrared spectroscopy to spot particles as small as 300 nanometers, about 30 times smaller than what previous studies could detect.
When you can see that small, you find a lot more plastic. In the tap water samples, 80 percent of the particles were smaller than 5 micrometers, meaning earlier studies missed four out of every five pieces of plastic in the water.
Size Matters More Than You Think
Not all plastic particles behave the same way in your body. Large pieces, anything over 150 micrometers, generally pass through your digestive system without getting absorbed. Smaller particles between 10 and 130 micrometers can migrate into tissues. Below 10 micrometers, they can get inside cells. And nanoplastics under 1 micrometer? Those can cross the blood-brain barrier.
This is why the high nanoplastic counts matter so much. It’s not about the total mass of plastic, though the study did measure that too. It’s about how many particles are small enough to end up in places plastic shouldn’t be.
Scientists are still working out what happens when plastic accumulates in organs and tissues. The research is young and the health effects aren’t fully understood. But the fact that nanoplastics can reach your brain should probably be reason enough to limit exposure where you can.
And here’s the thing: this study only measured down to 300 nanometers. Nanoplastics come smaller than that. The actual number of plastic particles in drinking water is almost certainly higher than even these eye-popping figures suggest.
Hart tells StudyFinds the research impacted her own perspective on drinking water. “This has definitely changed my own drinking habits,” she says. “I was primarily a tap water drinker before, knowing that disposable bottles were bad for the environment, but this is something I am even more adamant about now, and I swapped my reusable plastic bottle for a reusable metal one.”

What This Means For Your Water Bottle
The choice between bottled and tap water just got clearer. While the ranges overlap at the margins, bottled water on average showed about double the plastic particle concentration, especially the smaller nanoplastics that pose the greatest concern for entering your bloodstream and organs.
If you’re buying bottled water because you think it’s cleaner or safer than tap, the data doesn’t support that assumption, at least not when it comes to plastic contamination. The bottle itself becomes part of the problem.
“My overall suggestion for readers is to eliminate or reduce bottled water consumption to reduce their daily exposure to MNPs, and to really step back and evaluate how much plastic they use in their daily lives,” says Hart. “Micro and nanoplastics aren’t going anywhere anytime soon, but we can take steps today to reduce their abundance in the future by limiting our plastic consumption, especially single-use items.”
The simplest way to cut your exposure is obvious: drink tap water. Better yet, filter your tap water and put it in a reusable bottle made of glass or stainless steel. You’ll still get some plastic particles from the source water, but you’ll avoid the additional contamination that comes from the container.
None of this means drinking water will kill you. But when one option typically gives you half the plastic exposure of another, and that option is also cheaper and better for the environment, the choice seems pretty straightforward.
“I tell everyone to stop buying bottled water and drink tap water instead,” says Hart.
Disclaimer: This article discusses experimental research on microplastics and nanoplastics in drinking water. While studies show these particles can be absorbed by the body, the long-term health effects in humans are still being investigated and are not yet fully understood. This article is for informational purposes and should not be considered medical advice. Consult with your healthcare provider if you have specific health concerns about drinking water contaminants.
Paper Notes
Limitations
Each bottled water brand was analyzed once, while tap water samples were analyzed in duplicate. The method for estimating plastic mass assumes particles are elliptical and uses average densities, which may not account for irregular shapes or variations in polymer composition. The lower detection limit was 300 nanometers, meaning smaller nanoplastics were not captured. The researchers note that sample processing steps like agitation and ultrasound may have broken larger particles into smaller ones, potentially inflating the nanoplastic count, though efforts were made to minimize this effect.
Funding and Disclosures
This research was funded by the U.S. National Oceanic and Atmospheric Administration through Ohio Sea Grant College Program grant GR126908. The authors used equipment at the Center for Chemical and Biophysical Dynamics, funded by National Science Foundation grant CHE-2117225, and the Center for Electron Microscopy and Analyses. The authors declared no competing interests.
Publication Details
Authors: Megan N. Jamison Hart and John J. Lenhart, The Ohio State University, Department of Civil, Environmental and Geodetic Engineering | Title: “What’s in your water? A comparative analysis of micro- and nanoplastics in treated drinking water and bottled water” | Journal: Science of the Total Environment, Volume 1011, 2026, Article 181148 | DOI: 10.1016/j.scitotenv.2025.181148 | Timeline: Received June 10, 2025; revised December 2, 2025; accepted December 3, 2025; published online December 17, 2025
The above was reviewed by Steve Fink and research led by Megan N. Jamison Hart and John J. Lenhart (The Ohio State University)